Sample Grafana Cloud Dashboard
Grafana Cloud Dashboard
CloudFlow provides a sample dashboard that you can import into your Grafana Cloud account so that you can view metrics for your running projects.
In order to use it, click on the link above and follow Grafana's instructions.
In order to understand the panels on the dashboard, it is useful to understand the AEE workflow.
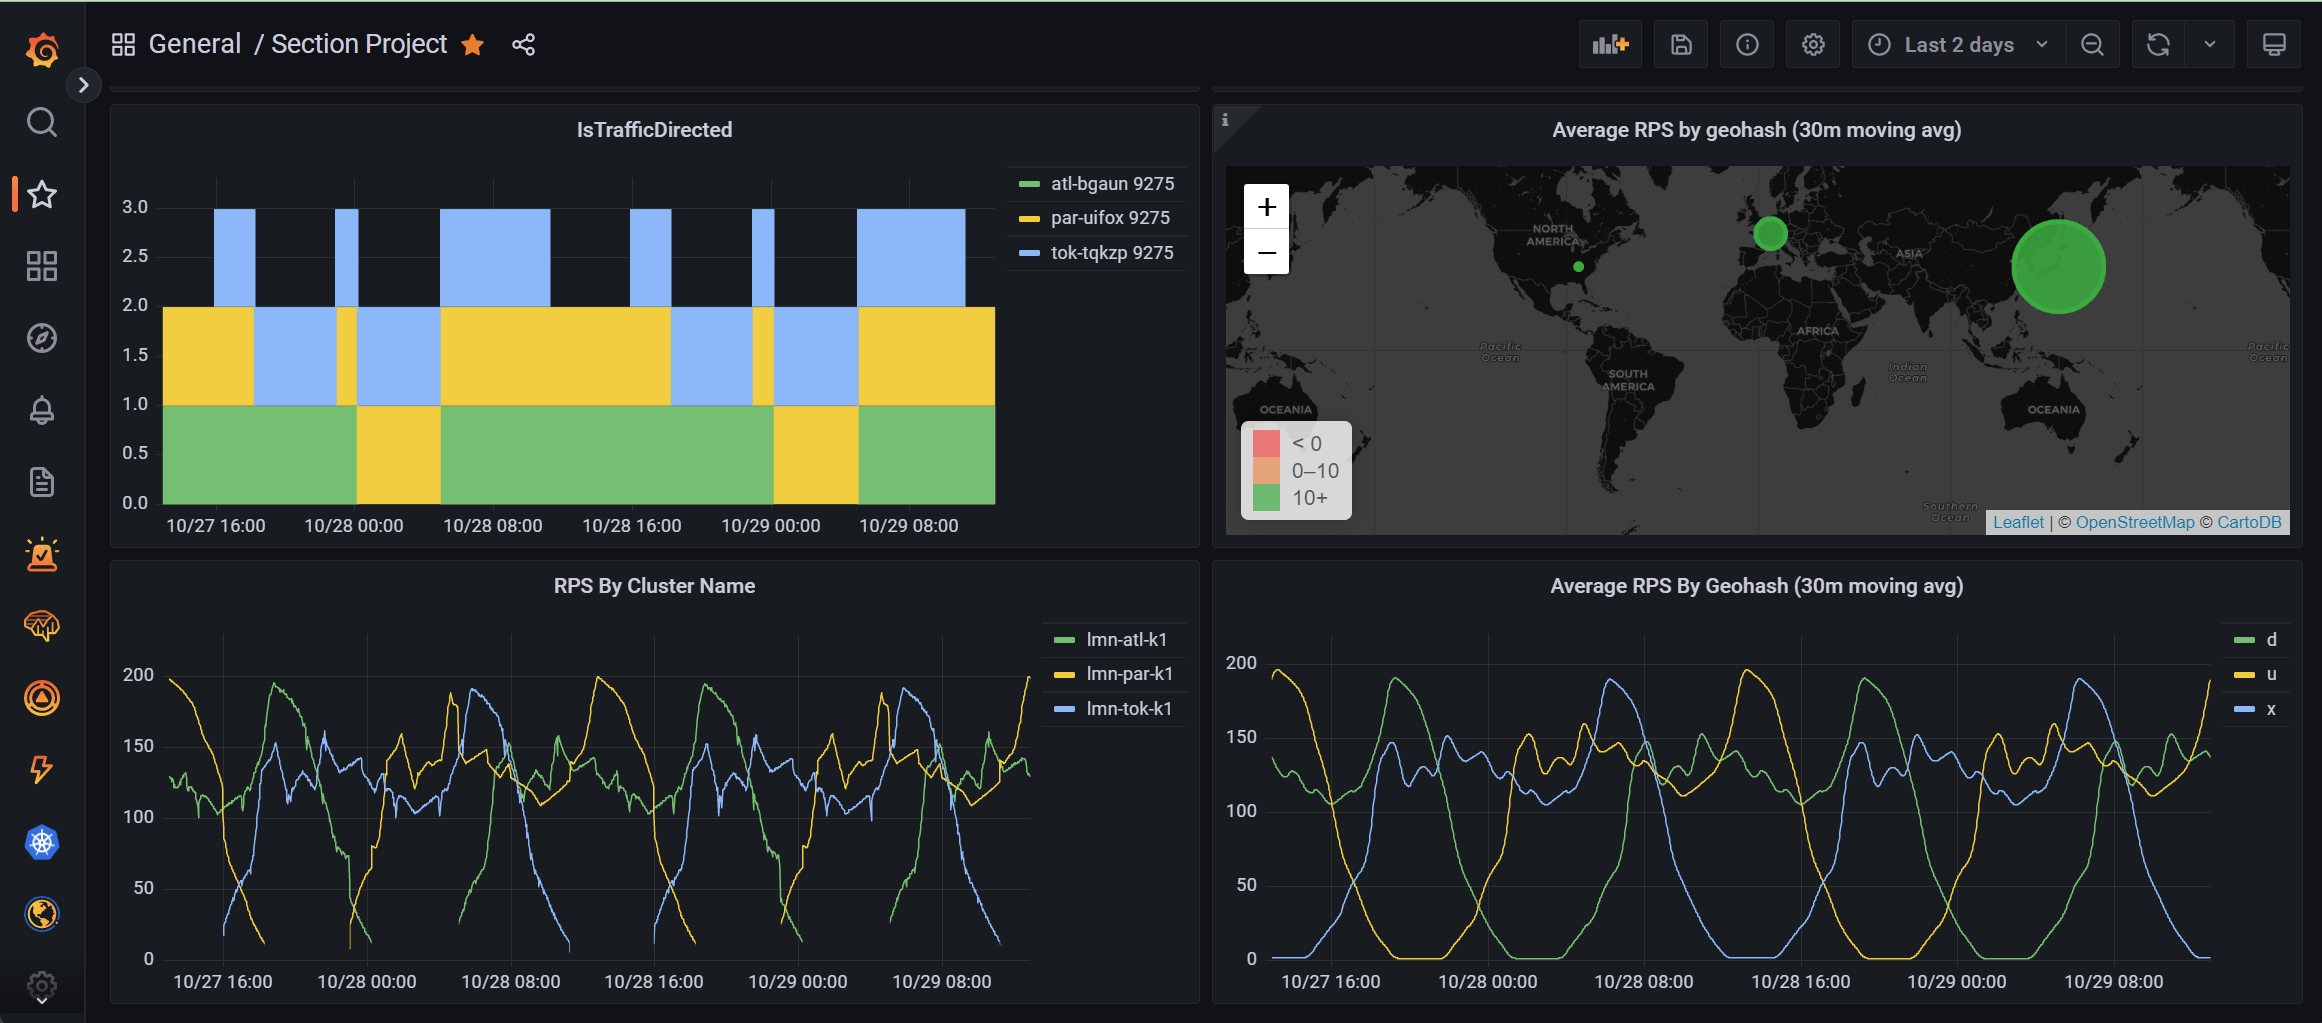
Panels on the dashboard:
- Locations Selected - locations that are selected by the AEE, but maybe have not yet become ready yet.
- Is Ready - locations that are deployed and healthy and ready for traffic to be directed.
- Is Traffic Directed - the AEE has updated Internet records so that traffic will find the workload.
- Average RPS by geohash (map view) - average requests per second by 2-letter geohash of the end-user location (the origination of the request). The size of the circles are the magnitude of the signal. There are two circles representing two points in time. Learn about geohash.
- RPS by Location - requests per second arriving at each location (from where the requests are served).
- Average RPS by geohash (time series view) - average requests per second by 2-letter geohash of the end-user location (the origination of the request). It is a 30 minute moving average. The intent of the 30 minute moving average is that it creates a clearer signal. This is the same metric as shown in the map view.
- Additional panels show traditional Prometheus metrics for your pods.