Exporting to Grafana using Docker
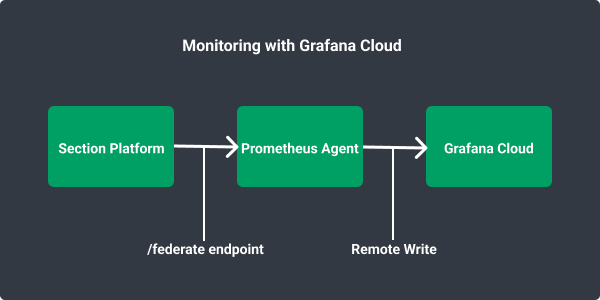
Monitoring with Grafana Cloud
Here we provide a simple example of how to scrape CloudFlow metrics into Grafana Cloud using docker run. The basic idea is that you need to run a Prometheus agent that regularly scrapes CloudFlow’s /federate endpoint to fetch metrics, and writes the results into Grafana Cloud using “remote write”. (At the time of this writing Grafana Cloud has no way to do the scraping itself.)
You may run the Prometheus agent on any infrastructure of your choice. It could be in a docker container on your PC, hosted on a cloud provider, or even hosted at CloudFlow. A single agent can be used to scrape all of the metrics for your account.
Obtain the following information from your instance of Grafana Cloud:
GRAFANA_METRICS_INSTANCE_ID: obtain from Grafana CloudGRAFANA_API_KEY: obtain from Grafana CloudGRAFANA_METRICS_INSTANCE_REMOTE_WRITE_ENDPOINT:- Is of the form: https://…/api/prom/push
Useful Links
- Get started with Grafana Cloud
- Learn about how to setup your Prometheus Agent
Configuration for a Prometheus Docker Container
The following YAML file configures a docker container that will run Prometheus, scrape CloudFlow’s /federate endpoint, and write the results into Grafana Cloud. Replace the following accordingly: CLOUDFLOW_ACCOUNT_ID, CLOUDFLOW_API_TOKEN, GRAFANA_METRICS_INSTANCE_REMOTE_WRITE_ENDPOINT, GRAFANA_METRICS_INSTANCE_ID, GRAFANA_API_KEY.
# my global config
global:
  scrape_interval:     30s # Set the scrape interval to every 15 seconds. Default is every 1 minute.
  evaluation_interval: 30s # Evaluate rules every 15 seconds. The default is every 1 minute.
  # scrape_timeout is set to the global default (10s).

  # Attach these labels to any time series or alerts when communicating with
  # external systems (federation, remote storage, Alertmanager).
  external_labels:
      monitor: 'cloudflow-monitor'

# Load rules once and periodically evaluate them according to the global 'evaluation_interval'.
rule_files:
  # - "first.rules"
  # - "second.rules"

# A scrape configuration containing exactly one endpoint to scrape:
# Here it's Prometheus itself.
scrape_configs:
  # The job name is added as a label `job=<job_name>` to any timeseries scraped from this config.
  - job_name: 'cloudflow-federation'
    metrics_path: '/prometheus/account/CLOUDFLOW_ACCOUNT_ID/federate'
    params:
      'match[]':
        - '{__name__=~".+"}'
    scheme: 'https'
    authorization:
      type: Bearer
      credentials: CLOUDFLOW_API_TOKEN
    static_configs:
      - targets: ['console.section.io']
remote_write:
- url: GRAFANA_METRICS_INSTANCE_REMOTE_WRITE_ENDPOINT
  basic_auth:
    username: GRAFANA_METRICS_INSTANCE_ID
    password: GRAFANA_API_KEY
The command to run the container is as follows. Replace /home/myhome accordingly.
docker run \
    -p 9090:9090 \
    -v /home/myhome/prometheus.yml:/etc/prometheus/prometheus.yml \
    prom/prometheus