Sample Datadog Dashboard
Datadog Dashboard
CloudFlow provides a sample dashboard that you can import into your Datadog account so that you can view metrics for your running projects.
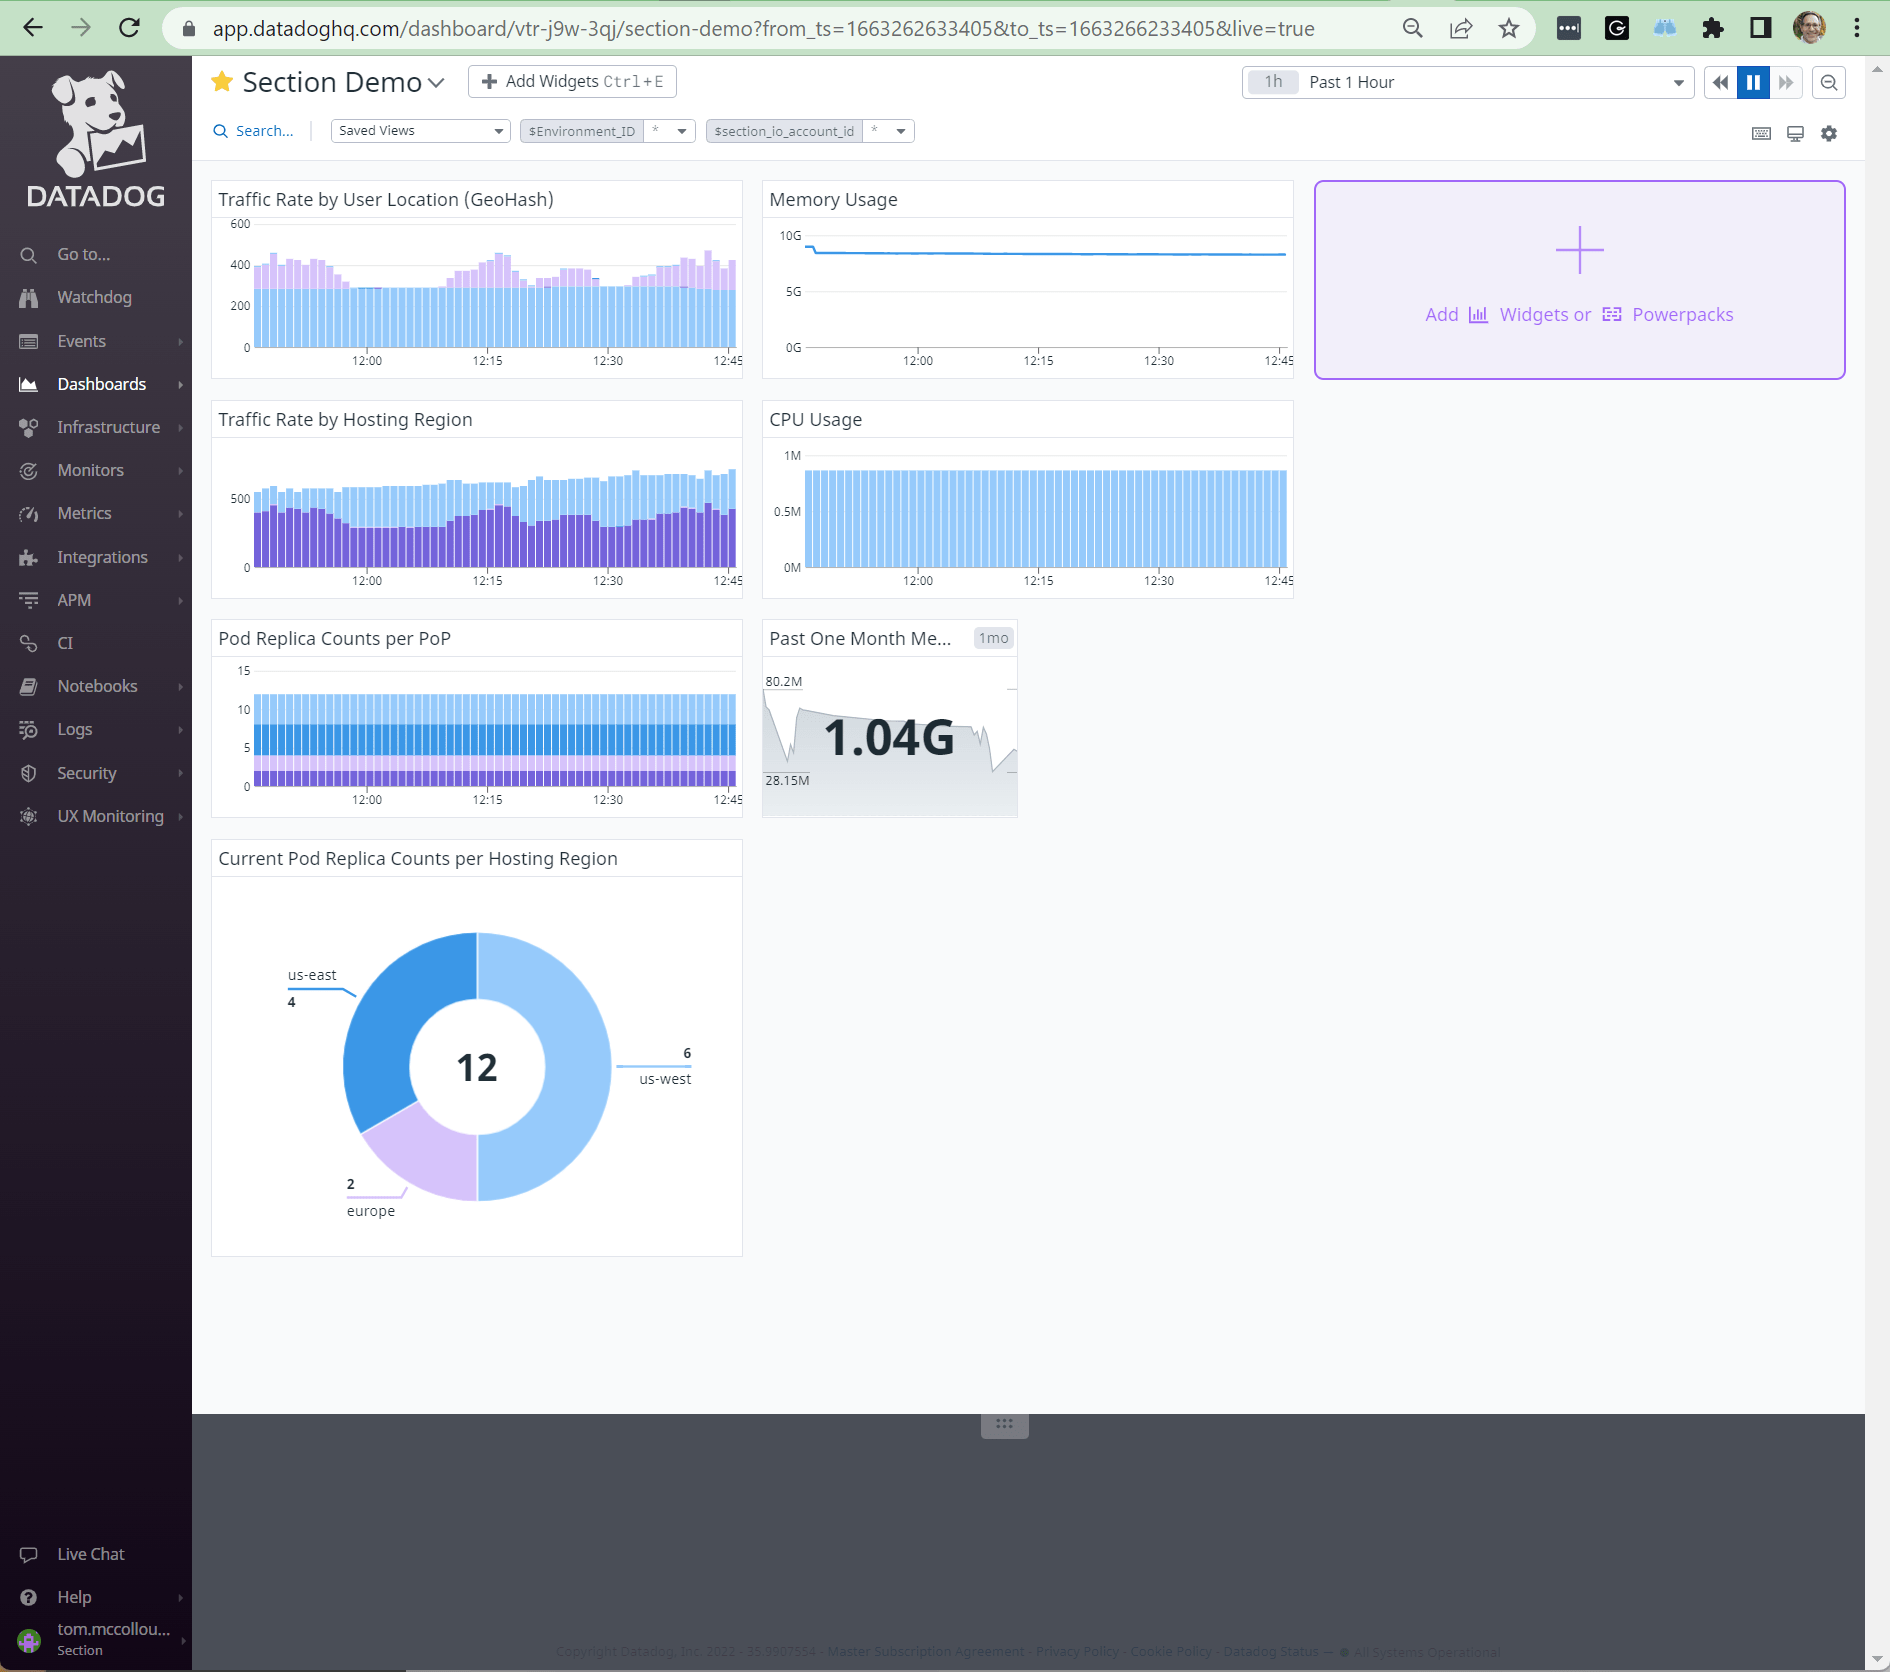
In order to use it, first make a new dashboard. Then copy the JSON below and paste it into the "Import dashboard JSON..." command that you'll find in the settings menu (gear icon) of your new dashboard.
sample-dashboard.json
{
"description" : "Example dashboard for monitoring workloads on CloudFlow.",
"id" : "vtr-j9w-3qj",
"is_read_only" : false,
"layout_type" : "ordered",
"notify_list" : [],
"reflow_type" : "fixed",
"template_variables" : [
{
"available_values" : [],
"default" : "*",
"name" : "Environment_ID",
"prefix" : "section_io_environment_id"
},
{
"available_values" : [],
"default" : "*",
"name" : "section_io_account_id",
"prefix" : "section_io_account_id"
}
],
"title" : "CloudFlow Demo",
"widgets" : [
{
"definition" : {
"legend_columns" : [
"avg",
"min",
"max",
"value",
"sum"
],
"legend_layout" : "auto",
"requests" : [
{
"display_type" : "bars",
"formulas" : [
{
"alias" : "Japan",
"formula" : "query2"
},
{
"alias" : "US West",
"formula" : "query1"
},
{
"alias" : "Europe West",
"formula" : "query3"
},
{
"alias" : "Australia East",
"formula" : "query4"
},
{
"alias" : "Australia West",
"formula" : "query5"
},
{
"alias" : "Europe South",
"formula" : "query6"
},
{
"alias" : "US East",
"formula" : "query7"
},
{
"alias" : "Spain",
"formula" : "query8"
},
{
"alias" : "Canada West",
"formula" : "query9"
},
{
"alias" : "Canada East",
"formula" : "query10"
}
],
"queries" : [
{
"data_source" : "metrics",
"name" : "query2",
"query" : "sum:section.section_http_request_count_total_sum_rate{geo_hash:x*,$Environment_ID,$section_io_account_id}"
},
{
"data_source" : "metrics",
"name" : "query1",
"query" : "sum:section.section_http_request_count_total_sum_rate{geo_hash:9*,$Environment_ID,$section_io_account_id}"
},
{
"data_source" : "metrics",
"name" : "query3",
"query" : "sum:section.section_http_request_count_total_sum_rate{geo_hash:u*,$Environment_ID,$section_io_account_id}"
},
{
"data_source" : "metrics",
"name" : "query4",
"query" : "sum:section.section_http_request_count_total_sum_rate{geo_hash:r*,$Environment_ID,$section_io_account_id}"
},
{
"data_source" : "metrics",
"name" : "query5",
"query" : "sum:section.section_http_request_count_total_sum_rate{geo_hash:q*,$Environment_ID,$section_io_account_id}"
},
{
"data_source" : "metrics",
"name" : "query6",
"query" : "sum:section.section_http_request_count_total_sum_rate{geo_hash:s*,$Environment_ID,$section_io_account_id}"
},
{
"data_source" : "metrics",
"name" : "query7",
"query" : "sum:section.section_http_request_count_total_sum_rate{geo_hash:d*,$Environment_ID,$section_io_account_id}"
},
{
"data_source" : "metrics",
"name" : "query8",
"query" : "sum:section.section_http_request_count_total_sum_rate{geo_hash:e*,$Environment_ID,$section_io_account_id}"
},
{
"data_source" : "metrics",
"name" : "query9",
"query" : "sum:section.section_http_request_count_total_sum_rate{geo_hash:c*,$Environment_ID,$section_io_account_id}"
},
{
"data_source" : "metrics",
"name" : "query10",
"query" : "sum:section.section_http_request_count_total_sum_rate{geo_hash:f*,$Environment_ID,$section_io_account_id}"
}
],
"response_format" : "timeseries",
"style" : {
"line_type" : "solid",
"line_width" : "normal",
"palette" : "dog_classic"
}
}
],
"show_legend" : true,
"title" : "Traffic Rate by User Location (GeoHash)",
"title_align" : "left",
"title_size" : "16",
"type" : "timeseries"
},
"id" : 1717949282816228,
"layout" : {
"height" : 2,
"width" : 4,
"x" : 0,
"y" : 0
}
},
{
"definition" : {
"legend_columns" : [
"avg",
"min",
"max",
"value",
"sum"
],
"legend_layout" : "auto",
"requests" : [
{
"display_type" : "line",
"formulas" : [
{
"alias" : "Memory Bytes",
"formula" : "query1"
}
],
"queries" : [
{
"data_source" : "metrics",
"name" : "query1",
"query" : "sum:section.section_container_memory_usage_bytes{$Environment_ID,$section_io_account_id}"
}
],
"response_format" : "timeseries",
"style" : {
"line_type" : "solid",
"line_width" : "normal",
"palette" : "dog_classic"
}
}
],
"show_legend" : true,
"title" : "Memory Usage",
"title_align" : "left",
"title_size" : "16",
"type" : "timeseries"
},
"id" : 9006760416875348,
"layout" : {
"height" : 2,
"width" : 4,
"x" : 4,
"y" : 0
}
},
{
"definition" : {
"legend_columns" : [
"avg",
"min",
"max",
"value",
"sum"
],
"legend_layout" : "auto",
"requests" : [
{
"display_type" : "bars",
"formulas" : [
{
"formula" : "query1"
}
],
"queries" : [
{
"data_source" : "metrics",
"name" : "query1",
"query" : "sum:section.section_http_request_count_total_sum_rate{$Environment_ID,$section_io_account_id} by {traffic_monitor_region}"
}
],
"response_format" : "timeseries",
"style" : {
"line_type" : "solid",
"line_width" : "normal",
"palette" : "dog_classic"
}
}
],
"show_legend" : true,
"title" : "Traffic Rate by Hosting Region",
"title_align" : "left",
"title_size" : "16",
"type" : "timeseries"
},
"id" : 7753833068014912,
"layout" : {
"height" : 2,
"width" : 4,
"x" : 0,
"y" : 2
}
},
{
"definition" : {
"legend_columns" : [
"avg",
"min",
"max",
"value",
"sum"
],
"legend_layout" : "auto",
"requests" : [
{
"display_type" : "bars",
"formulas" : [
{
"alias" : "CPU Seconds",
"formula" : "query1"
}
],
"queries" : [
{
"data_source" : "metrics",
"name" : "query1",
"query" : "sum:section.section_container_cpu_usage_seconds_total{$Environment_ID,$section_io_account_id}"
}
],
"response_format" : "timeseries",
"style" : {
"line_type" : "solid",
"line_width" : "normal",
"palette" : "dog_classic"
}
}
],
"show_legend" : true,
"title" : "CPU Usage",
"title_align" : "left",
"title_size" : "16",
"type" : "timeseries"
},
"id" : 3621217572418110,
"layout" : {
"height" : 2,
"width" : 4,
"x" : 4,
"y" : 2
}
},
{
"definition" : {
"legend_columns" : [
"avg",
"min",
"max",
"value",
"sum"
],
"legend_layout" : "auto",
"requests" : [
{
"display_type" : "bars",
"formulas" : [
{
"formula" : "query1"
}
],
"queries" : [
{
"data_source" : "metrics",
"name" : "query1",
"query" : "sum:section.section_kube_pod_status_ready{$Environment_ID,$section_io_account_id} by {cluster_name}"
}
],
"response_format" : "timeseries",
"style" : {
"line_type" : "solid",
"line_width" : "normal",
"palette" : "dog_classic"
}
}
],
"show_legend" : true,
"title" : "Pod Replica Counts per PoP",
"title_align" : "left",
"title_size" : "16",
"type" : "timeseries"
},
"id" : 7859494613804218,
"layout" : {
"height" : 2,
"width" : 4,
"x" : 0,
"y" : 4
}
},
{
"definition" : {
"autoscale" : true,
"precision" : 2,
"requests" : [
{
"formulas" : [
{
"formula" : "query1"
}
],
"queries" : [
{
"aggregator" : "sum",
"data_source" : "metrics",
"name" : "query1",
"query" : "avg:section.section_container_memory_usage_bytes{$Environment_ID,$section_io_account_id}"
}
],
"response_format" : "scalar"
}
],
"time" : {
"live_span" : "1mo"
},
"timeseries_background" : {
"type" : "area"
},
"title" : "Past One Month Memory-(Hour??) Consumption",
"title_align" : "left",
"title_size" : "16",
"type" : "query_value"
},
"id" : 531138098289886,
"layout" : {
"height" : 2,
"width" : 2,
"x" : 4,
"y" : 4
}
},
{
"definition" : {
"legend" : {
"type" : "automatic"
},
"requests" : [
{
"formulas" : [
{
"formula" : "query1",
"limit" : {
"order" : "desc"
}
}
],
"queries" : [
{
"aggregator" : "last",
"data_source" : "metrics",
"name" : "query1",
"query" : "sum:section.section_kube_pod_status_ready{$Environment_ID,$section_io_account_id} by {traffic_monitor_region}"
}
],
"response_format" : "scalar"
}
],
"title" : "Current Pod Replica Counts per Hosting Region",
"title_align" : "left",
"title_size" : "16",
"type" : "sunburst"
},
"id" : 3390659206599044,
"layout" : {
"height" : 4,
"width" : 4,
"x" : 0,
"y" : 6
}
}
]
}