Reduce Database Latency with Global Caching
You've decided to distribute your app closer to your users for increased performance. But if you also leverage a central relational database, how do you prevent that from being a performance bottleneck? In this tutorial we use PolyScale.ai to address this problem. PolyScale provides a global database cache as a service that automatically handles cache lifetimes and invalidation. It is wire-protocol compatible with multiple databases (MySQL, Postgres, etc.). This enables you to scale your single, fixed-location database without requiring changes in your code, operating read-replicas, or incurring the cost of nodes for a distributed database.
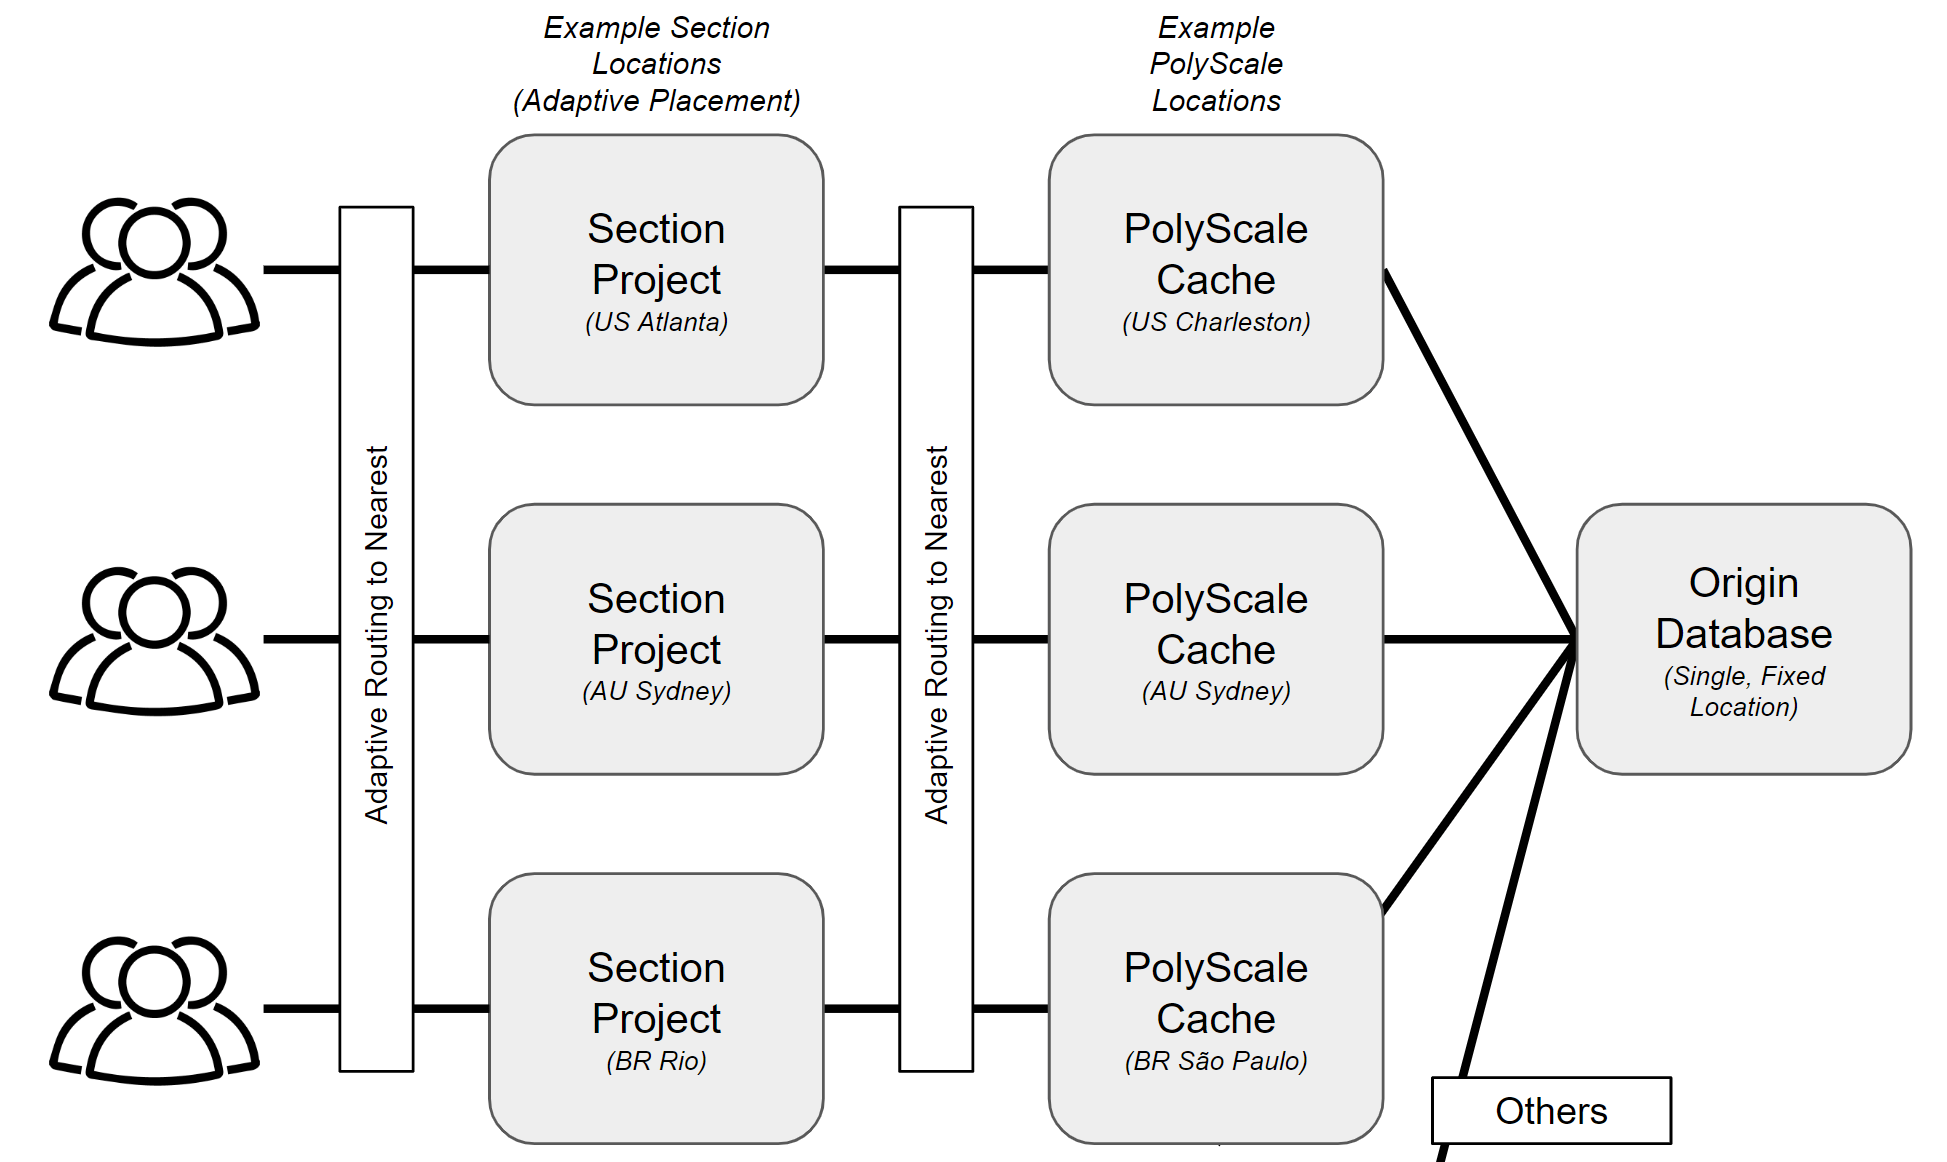
What we've built is a simple performance testing app that executes a query:
- from every CloudFlow location where your project is deployed,
- into the nearest PolyScale.ai cache location,
- and then in-turn into your origin database for any cache misses.
The query executes every 60 seconds and emits a log entry with latency measurements. For those who want to go further, we provide an Extra Credit section that shows you how to scrape a metrics endpoint and send data to Grafana Cloud for charting.
There is no need to build the Docker image, we provide one for you on https://ghcr.io/section/polyscale-metrics. The deployment yaml refers to that one, although we've provided a Dockerfile if you'd like to customize it.
You just need to substitute your secrets and connection strings and deploy the yamls to your CloudFlow Project.
Checkout our Mastodon hosting tutorial for an example use case!
Prerequisites
- You'll need a small example SQL database from PolyScale's supported types. The actual contents do not matter. A simple Supabase that you create yourself will suffice, or you can use a sample read-only database URL that we provide so that you don't have to create your own.
- Create an account and global cache for your database at PolyScale.ai.
note
Before starting, create a new CloudFlow Project and then delete the default Deployment and ingress-upstream Service to prepare the project for your new deployment.
The Basic Idea
Clone our repo to get started: https://github.com/section/polyscale-metrics.
The meat of the app is this small snippet located in dbQuery() in polyscale_metrics.go:
...
    // Time the query
    start := time.Now()
    rows, err := conn.Query(context.Background(), query)
    duration := time.Since(start)
The above query is called twice, once against the cache and once against the origin. It repeats this process forever with a sleep in between, logging the results to stdout. That's all there is to it.
Setup Your Databases
Here is a snipped of the deployment yaml showing the container environment variables that you'll need pertaining to your database.
...
        env:
          - name: NODE_NAME
            valueFrom:
              fieldRef:
                fieldPath: spec.nodeName
          - name: CACHE_DATABASE_URL
            value: YOUR_CACHE_DATABASE_URL
          - name: ORIGIN_DATABASE_URL
            value: YOUR_ORIGIN_DATABASE_URL
          - name: QUERY
            value: YOUR_QUERY
If you don't want to create your own database, use ours:
ORIGIN_DATABASE_URL is postgresql://read_only_user:8BiusLd6Z89kjVgS@database-hasura-1.cluster-cf59c7eojxdx.us-west-1.rds.amazonaws.com:5432/postgres
CACHE_DATABASE_URL is whatever PolyScale gives you
QUERY is "SELECT * from pets.pet_names limit 1;"
And then from that database create a PolyScale cache by clicking on the New Cache button in the top-right corner. If you use our database, tt is a Postgres database, host is database-hasura-1.cluster-cf59c7eojxdx.us-west-1.rds.amazonaws.com, and port is 5432.
Deployment
Replace the three strings accordingly and apply your modified deployment resource to your CloudFlow Project with either the Kubernetes dashboard or kubectl apply -f polyscale-metrics-deployment.yaml.
See the pods running with kubectl get pods -o wide.
$ kubectl get pods -o wide
NAME                                 READY   STATUS    RESTARTS   AGE   IP              NODE        NOMINATED NODE   READINESS GATES
polyscale-metrics-86449c4f7d-qtrwd   1/1     Running   0          12m   10.244.70.138   sof-zzbd7   <none>           <none>
polyscale-metrics-86449c4f7d-sgqs9   1/1     Running   0          12m   10.244.48.80    rio-kz6s3   <none>           <none>
And pick one of the pod names to see its logs using kubectl logs POD.
$ kubectl logs polyscale-metrics-86449c4f7d-sgqs9
Node lmn-rio-k1-shared-ingress12 listening to /metrics on port :2112 interval 300 s query select * from foodsales limit 1;
nodename lmn-rio-k1-shared-ingress12 cache 618ms origin 634ms
nodename lmn-rio-k1-shared-ingress12 cache 9ms origin 316ms
nodename lmn-rio-k1-shared-ingress12 cache 9ms origin 316ms
Explore the other pods as well to see the speed of the cache from other locations.
That's it!
Move the Workload Around
Use the location optimizer to cause your project to move to other locations so that you can see how CloudFlow and PolyScale work together.
Extra Credit: Metrics in Grafana
Our GoLang app exposes a metrics endpoint so that you can scrape p50, p90, and p95 query latencies into a 3rd party metrics system such as Grafana Cloud. Read more in our tutorial about scraping metrics into Grafana.
Replace items in the remote_write section of the ConfigMap:
...
    remote_write:
    - url: GRAFANA_METRICS_INSTANCE_REMOTE_WRITE_ENDPOINT
      basic_auth:
        username: GRAFANA_METRICS_INSTANCE_ID
        password: GRAFANA_API_KEY
And apply with kubectl apply -f grafana-app-scrape-configmap.yaml.
In the Deployment resource no substitutions required. So just apply with kubectl apply -f grafana-app-agent-deployment.yaml.
And finally, in order for the Grafana agent to contact the polyscale-metrics-service pod, you'll need a Kubernetes Service resource. We've provided that for you, so just apply with kubectl apply -f polyscale-metrics-service.yaml. This exposes http://polyscale-metrics-service:80 within your CloudFlow project so that the Grafana agent can access the metrics endpoint.
Then go to the Explore menu in Grafana Cloud to start charting your metrics!