Edge computing is complex. We can attest to this, having built an edge compute platform from the ground up. One of the fundamental challenges that we’ve faced along this journey, is helping people understand exactly what their edge stack is doing and the value that it’s delivering. Dashboards and graphs just don’t tell the full story.
Over the past year, we’ve been working on some innovative observability tooling to help users better understand, troubleshoot, and optimize their edge environments.
Our goal: Go beyond standard dashboards and graphs to give users an immersive and holistic Edge observability experience.
The recent release of the new Traffic Monitor gives DevOps engineers, application owners, and business leaders an easy way to quickly visualize how traffic is flowing through their edge architecture, delivering valuable insights that transcend functional boundaries. (For more on the value that observability delivers, read our article Without Observability, DevOps is Doomed.)
Finding inspiration
When we started this journey, we took inspiration from some notable industry leaders, including Netflix and Kiali. Back in 2015, Netflix talked about building their innovative Flux tooling, giving them visibility into traffic coming into Netflix from the Internet and being routed to their AWS regions.
Taking inspiration from Netflix Flux
We were also intrigued by what Kiali was doing with their observability tooling around Istio service mesh, providing a visualization that answers the questions: What microservices are part of my Istio service mesh and how are they connected?

Taking inspiration from Kiali
Enlisting the design experts
In order to create a newly imagined edge visualization, we went searching for an experienced design team to help us translate our vision to product. Our search led us to MetaLab, whom you may know for their work designing Slack.
Through extensive research, cross-functional collaboration, creative discovery, user testing, and iteration, we arrived at designs to guide our product development.
Transforming pixels to product
Now the hard part - turning static designs into a dynamic, data-driven visualization! Fortunately, the Section engineering team responsible for the buildout was involved through the entire design process. This allowed us to design to what the underlying technology would support, while also providing intimate familiarity with design intentions and decisions.
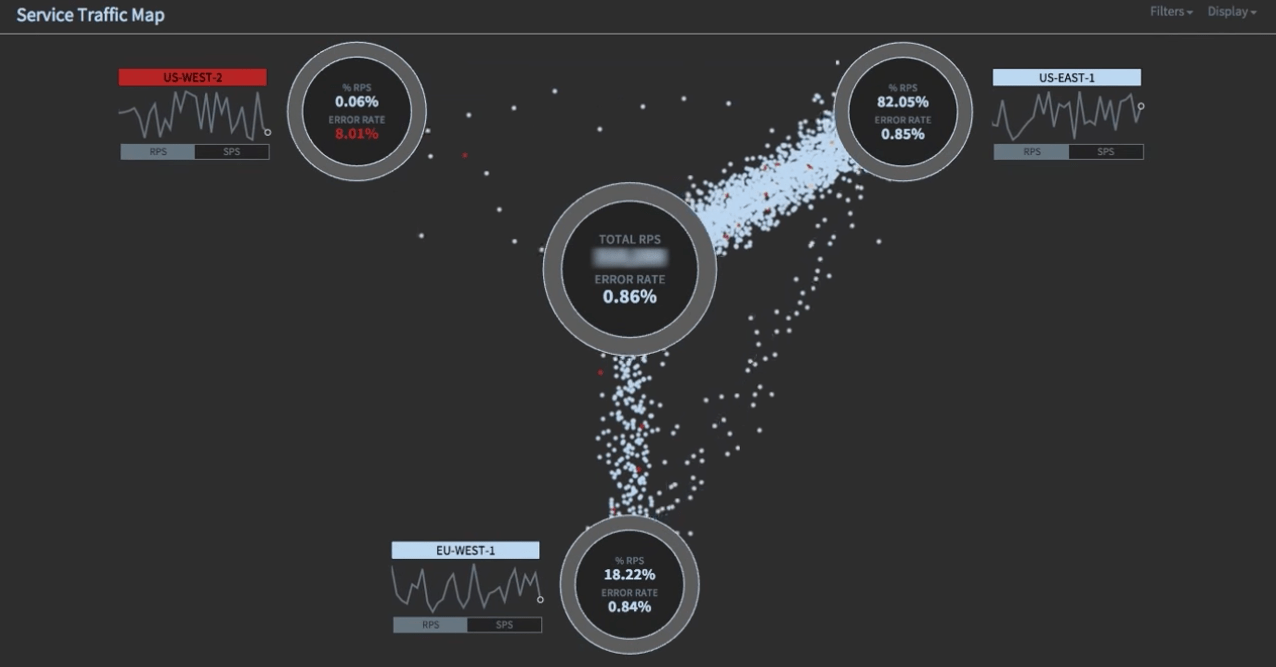
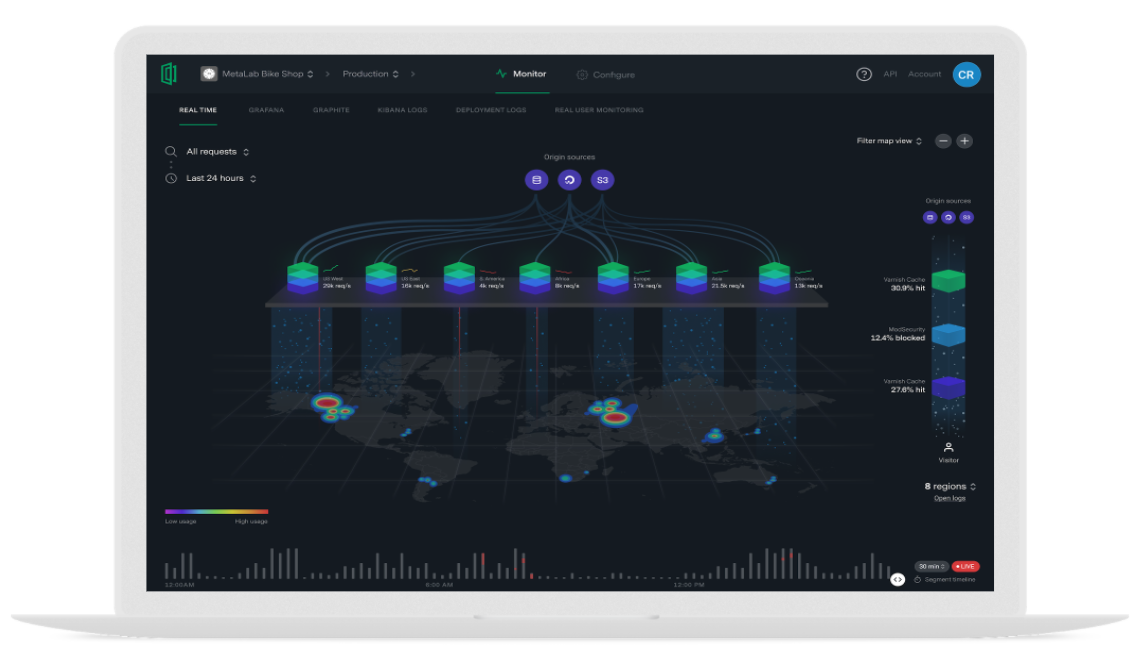
With Prometheus-based metrics driving the visualization, the Section Traffic Monitor introduces a real-time display of traffic activity on your web applications to more effectively:
- Understand how global traffic is flowing through your Section environment;
- Evaluate edge module throughput;
- Detect errors, including origin-fetch and module-related errors; and
- Share valuable metrics with key stakeholders.
Making hard decisions
As with any significant product innovation, we had to make some hard decisions along the way. Here are some of the notable challenges that we faced.
Display of Edge regions
One of the primary benefits of edge computing is the expansive global edge network that allows application logic to be processed closer to end users. However, showing hundreds/thousands of edge locations on a map would very quickly consume the display and get overwhelming. So, for the first iteration of the Traffic Monitor, we opted to consolidate edge points of presence (PoPs) into regions. As we continue to gather user feedback, we’re working to better understand how to deliver the most valuable insights around Edge locations and will iterate based on these findings.
Simplification without over-simplification
As we mentioned at the start, edge computing is complex, and there’s no shortage of data available to display. One of the hardest challenges through this process has been prioritizing the importance of information for the majority of users. Where possible, we’ve attempted to surface the most important data, while still providing access for users to dig into deeper insights. Looking ahead, we’re exploring the idea of customizable views based on user-defined metrics.
Requests vs. responses
There was a lot of back-and-forth over the direction of the traffic dots, or more precisely, whether to represent traffic as requests, responses, or both in the animation flow. We explored all of the above, and ultimately landed on responses as the best indicator of system performance and health. Bi-directional traffic was too confusing, and request traffic didn’t really highlight the function that the Edge plays within the application architecture.
Flat Earth?
We can assure you, we’re not flat-Earthers! … As much as we wanted to depict Earth in its true form, we favored showing a holistic view over a partial view that would require user intervention or automated rotation. Even so, there are trade-offs in this approach as well. For example, if you watch the traffic transition from Oceania to the US West region, it appears that traffic is traveling across the globe, when in fact, it’s the next closest region to serve the traffic. This is another area where we’ll continue to seek innovative solutions.
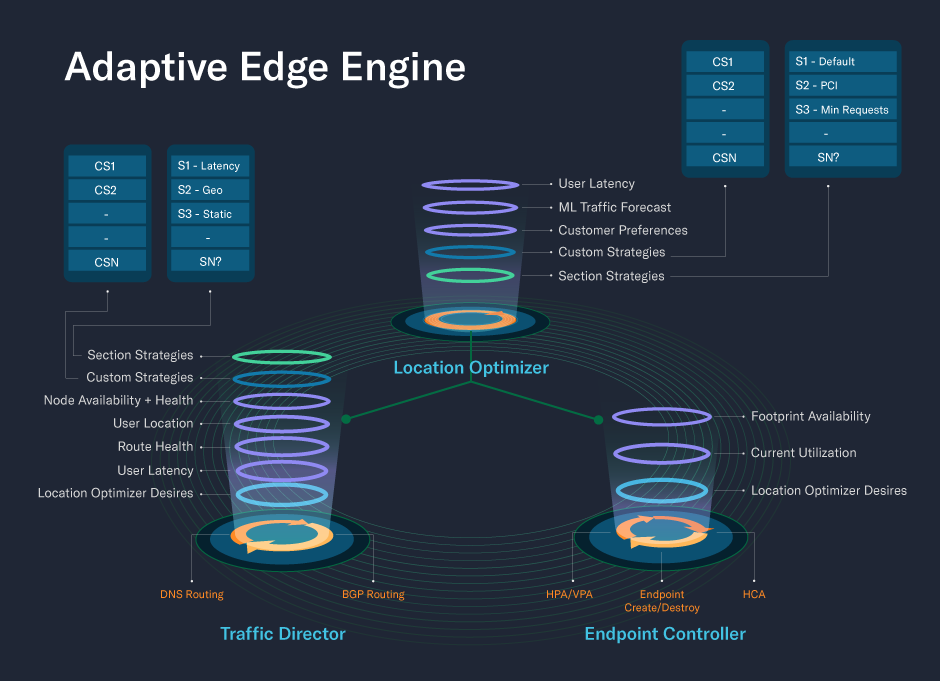
Bringing the Adaptive Edge Engine (AEE) to life
Aside from the functional benefits that the Traffic Monitor provides, it also allows users to visualize how Section’s underlying (patent pending) Adaptive Edge Engine (AEE) technology works. The AEE dynamically provisions edge resources and routes traffic based on real-time demands to optimize for performance, security, cost, and other strategic objectives. (See article Creating the Mutual Funds of Edge Computing.)
In the display below, you can see Edge regions spinning up and down across a 24-hour cycle as traffic patterns ‘follow the sun’.
Delivering value
There are so many use cases for teams to derive value from this visualization. A few practicle examples of how DevOps engineers are leveraging Section’s Traffic Monitor:
- Identify origin-fetch errors
- Detect a DDoS attack
- Understand cache hit rate
- Use traffic patterns to guide key business decisions
- Demonstrate Edge value to business leaders
If you’re interested in learning more about the Traffic Monitor or want to walk through how to get more value out of your Edge insights, contact our team of solutions engineers.